CMU 15-112: Fundamentals of Programming and Computer Science
Class Notes: Graphics in Tkinter
Notes
- We will only run graphics in Standard Python. These examples will not run in Brython.
- The standard Python documentation for tkinter can be hard to read. You can find our preferred documentation here (see chapter 8 on "The Canvas Widget").
- To run these examples, first download basic_graphics.py.
- Create an Empty Canvas
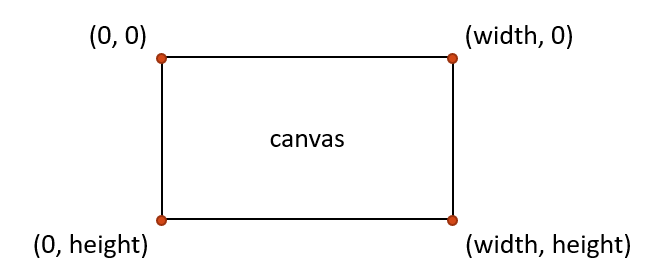
- Canvas Coordinates
- Draw a Line
- Draw a Rectangle with create_rectangle(left, top, right, bottom)
- Graphics Parameters
- Draw Other Shapes and Text
- Draw Custom Colors
- Draw Centered Shapes
- Graphics Helper Functions
- Dynamically Sizing Text
- Drawing Circular Patterns with Trigonometry
- Example: Clocks!
- More with basic_graphics.run()
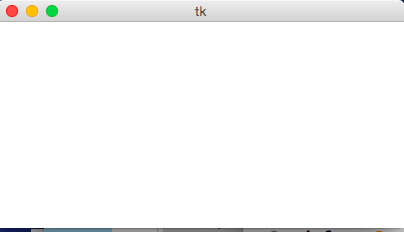
- Create an Empty Canvas
import basic_graphics def draw(canvas, width, height): pass # replace with your drawing code! basic_graphics.run(width=400, height=300)Result:
- Canvas Coordinates Note: unlike in math, the y axis grows down instead of up. Thus, (0, 0) is at the top left corner of the canvas.
- Draw a Line
def draw(canvas, width, height): # create_line(x1, y1, x2, y2) draws a line from (x1, y1) to (x2, y2) canvas.create_line(25, 50, width/2, height/2)Result:

- Draw a Rectangle with create_rectangle(left, top, right, bottom)
def draw(canvas, width, height): # The first four parameters are the upper-left (x,y) # and the lower-right (x,y) of the rectangle canvas.create_rectangle(0,0,150,150)Result:

- Graphics Parameters
def draw(canvas, width, height): # most graphics functions allow you to use optional parameters # to change the appearance of the object. These are written with the code # paramName=paramValue # after the core parameters in the code # fill changes the internal color of the shape canvas.create_rectangle( 0, 0, 150, 150, fill="yellow") # width changes the size of the border canvas.create_rectangle(100, 50, 250, 100, fill="orange", width=5) # outline changes the color of the border canvas.create_rectangle( 50, 100, 150, 200, fill="green", outline="red", width=3) # width=0 removes the border entirely canvas.create_rectangle(125, 25, 175, 190, fill="purple", width=0)Result:

- Draw Other Shapes and Text
def draw(canvas, width, height): # ovals provide the coordinates of the bounding box canvas.create_oval(100, 50, 300, 150, fill="yellow") # polygons and lines provide the (x,y) coordinates of each point # polygons must have 3+ points; lines must have 2+ canvas.create_polygon(100,30,200,50,300,30,200,10, fill="green") canvas.create_line(100, 50, 300, 150, fill="red", width=5) # text provides a single (x,y) point, then anchors the text there # text also requires the text, and can have a font canvas.create_text(200, 100, text="Amazing!", fill="purple", font="Helvetica 26 bold underline") canvas.create_text(200, 100, text="Carpe Diem!", anchor="sw", fill="darkBlue", font="Times 28 bold italic")Result:

- Draw Custom Colors
def rgbString(r, g, b): # Don't worry about the :02x part, but for the curious, # it says to use hex (base 16) with two digits. return f'#{r:02x}{g:02x}{b:02x}' def draw(canvas, width, height): pistachio = rgbString(147, 197, 114) maroon = rgbString(176, 48, 96) canvas.create_rectangle(0, 0, width/2, height/2, fill=pistachio) canvas.create_rectangle(width/2, height/2, width, height, fill=maroon)Result:

- Draw Centered Shapes
def draw(canvas, width, height): margin = 10 # Approach #1: Add margin to top/left, subtract margin from bottom/right: canvas.create_rectangle(margin, margin, width-margin, height-margin, fill="darkGreen") # Approach #2: add/subtract width/height from center (cx, cy) (cx, cy) = (width/2, height/2) (rectWidth, rectHeight) = (width/4, height/4) canvas.create_rectangle(cx - rectWidth/2, cy - rectHeight/2, cx + rectWidth/2, cy + rectHeight/2, fill="orange")Result:

- Graphics Helper Functions
def drawBelgianFlag(canvas, x0, y0, x1, y1): # draw a Belgian flag in the area bounded by (x0,y0) in # the top-left and (x1,y1) in the bottom-right width = (x1 - x0) canvas.create_rectangle(x0, y0, x0+width/3, y1, fill="black", width=0) canvas.create_rectangle(x0+width/3, y0, x0+width*2/3, y1, fill="yellow", width=0) canvas.create_rectangle(x0+width*2/3, y0, x1, y1, fill="red", width=0) def draw(canvas, width, height): # Draw a large Belgian flag drawBelgianFlag(canvas, 25, 25, 175, 150) # And draw a smaller one below it drawBelgianFlag(canvas, 75, 160, 125, 200) # Now let's have some fun and draw a whole grid of Belgian flags! flagWidth = 30 flagHeight = 25 margin = 5 for row in range(4): for col in range(6): left = 200 + col * flagWidth + margin top = 50 + row * flagHeight + margin right = left + flagWidth - margin bottom = top + flagHeight - margin drawBelgianFlag(canvas, left, top, right, bottom)Result:

- Dynamically sizing text
def draw(canvas, width, height): # Dynamically sizing text is harder, but possible! # Just compute the font size based on the width or height # Some guesswork helps to get the ratio right textSize = width // 10 canvas.create_text(width/2, height/2, text="Hello, World!", font=f'Arial {textSize} bold')Result:

- Drawing Circular Patterns with Trigonometry
Trig 101
- Circle centered at origin

- Circle centered at (cx, cy)

- Circle centered at (cx, cy) in Python graphics ("up is down!")

Example:import math def draw(canvas, width, height): (cx, cy, r) = (width/2, height/2, min(width, height)/3) canvas.create_oval(cx-r, cy-r, cx+r, cy+r, fill="yellow") r *= 0.85 # make smaller so time labels lie inside clock face for hour in range(12): hourAngle = math.pi/2 - (2*math.pi)*(hour/12) hourX = cx + r * math.cos(hourAngle) hourY = cy - r * math.sin(hourAngle) label = str(hour if (hour > 0) else 12) canvas.create_text(hourX, hourY, text=label, font="Arial 16 bold")Result:

- Circle centered at origin
- Example: Clocks!
import math def drawClock(canvas, x0, y0, x1, y1, hour, minute): # draw a clock in the area bounded by (x0,y0) in # the top-left and (x1,y1) in the bottom-right # with the given time # draw an outline rectangle canvas.create_rectangle(x0, y0, x1, y1, outline="black", width=1) # find relevant values for positioning clock width = (x1 - x0) height = (y1 - y0) r = min(width, height)/2 cx = (x0 + x1)/2 cy = (y0 + y1)/2 # draw the clock face canvas.create_oval(cx-r, cy-r, cx+r, cy+r, outline="black", width=2) # adjust the hour to take the minutes into account hour += minute/60.0 # find the hourAngle and draw the hour hand # but we must adjust because 0 is vertical and # it proceeds clockwise, not counter-clockwise! hourAngle = math.pi/2 - 2*math.pi*hour/12 hourRadius = r*1/2 hourX = cx + hourRadius * math.cos(hourAngle) hourY = cy - hourRadius * math.sin(hourAngle) canvas.create_line(cx, cy, hourX, hourY, fill="black", width=1) # repeat with the minuteAngle for the minuteHand minuteAngle = math.pi/2 - 2*math.pi*minute/60 minuteRadius = r*9/10 minuteX = cx + minuteRadius * math.cos(minuteAngle) minuteY = cy - minuteRadius * math.sin(minuteAngle) canvas.create_line(cx, cy, minuteX, minuteY, fill="black", width=1) def draw(canvas, width, height): # Draw a large clock showing 2:30 drawClock(canvas, 25, 25, 175, 150, 2, 30) # And draw a smaller one below it showing 7:45 drawClock(canvas, 75, 160, 125, 200, 7, 45) # Now let's have some fun and draw a whole grid of clocks! width = 40 height = 40 margin = 5 hour = 0 for row in range(3): for col in range(4): left = 200 + col * width + margin top = 50 + row * height + margin right = left + width - margin bottom = top + height - margin hour += 1 drawClock(canvas, left, top, right, bottom, hour, 0)Result:

- More with basic_graphics.run()
- Extra arguments to draw()
import basic_graphics # See how the extra arguments to draw are provided # as the first arguments to basic_graphics.run() def draw(canvas, width, height, message, color): canvas.create_text(width/2, height/2, text=message, fill=color) basic_graphics.run('This is cool!', 'blue', width=400, height=300) - Specifying the draw function
import basic_graphics # See how we can specify the draw function to use. # This lets us place multiple draw functions in the same file. def drawBigDot(canvas, width, height, color): cx, cy, r = width/2, height/2, min(width,height)/3 canvas.create_oval(cx-r, cy-r, cx+r, cy+r, fill=color) basic_graphics.run('purple', drawFn=drawBigDot)
- Extra arguments to draw()